What is the context for this assignment?
The course was Introductory Physics I (first physics course for science students). There were 30 students in the class, with two TA graders. The course prepares students for all future courses in physics by introducing the math and content that is prerequisite. Because of this, it can be difficult to fit in exciting developments in current physics and research that could inspire students.
Why did you choose to use a creative assignment?
Many students taking this course are used to STEM classes where they choose the right formula and plug in the answer. This assignment came early in the semester and helped set the tone for the type of thinking I wanted students to demonstrate throughout the semester. The goal of the assignment was to introduce students to an untraditional application of one of the concepts they were learning in class in the context of current research. My hope is that by introducing students to research earlier in their education they might see interesting applications of the more abstract or basic concepts. Another goal is to give students a more realistic problem that would discourage “algorithmic thinking” and instead encourage creativity to help build critical thinking. A third goal was to introduce students to a useful software tool that is frequently used by researchers in all of the sciences that will benefit students beyond physics class.
What was the assignment description?
Here is the assignment description I provided to students:
Modeling Plasma Velocity
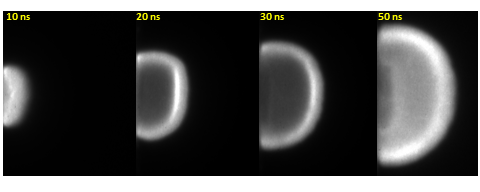
Kinematics has applications in current research through interpreting motion such as the motion of a plasma formed by a laser vaporizing a metal target. Your goal is to analyze and interpret four frames of the explosion below using the kinematics of velocity and fast motion capture that we discussed in class.

The motion of the plasma is measured by the change in its expanding length over time. You can consider the length of each of the four plumes starting from the leftmost part of each image to the edge of the bright hemisphere for each timepoint marked in the upper left corner. Please provide an organized table of your measurements of length for each timepoint.
Measurements can be made using the open-source NIH software ImageJ.
Use your measurements to design figures for both average and instantaneous velocity vs. time that you could use to explain the “Plume Image” data.
How did you scaffold this assignment?
The assignment was accompanied by mini-lectures that introduced the necessary equations and background on graphing motion. I gave a brief introduction to the context of the research itself in a preceding lecture. I also included a separate tutorial with illustrations on how to use the provided software.
How did you grade students?
Student work was graded on accuracy and neatness. In order to receive full credit, students must include the velocity figures and their measurements recorded in an organized manner. The most difficult part of the assignment was introducing students to the software. Computer proficiency of science students at the beginning of their college education often varies widely. Some students had difficulty with using the software despite the tutorial. Another difficulty was that some students had difficulty making nice looking figures in excel. Both of these problems were largely remedied by inviting students to office hours and walking them through troubleshooting.
What did students submit?
All students were able to complete the assignment. Performance on the measurement task was good overall and all students were able to make at least one complete figure. Although carelessness with converting measurements did happen in some of the submissions, points lost were mostly from confusion over how to estimate “instantaneous velocity.”
There were multiple exemplary submissions, where students different strengths were highlighted. For example, one student paid a lot of attention to the way they made the instantaneous velocity graphs, while another student provided a lot of their thinking in the written explanation. The sample submission is an example of a student with an excellent written explanation.
What lessons did you learn?
Anecdotally, this assignment appeared to have a positive impact on students. It helped them prepare for some open-ended questions I asked later in the semester. A few students also shared that they appreciated applied examples.
Assignments that go beyond standard textbook problems invite more work on the instructor, who must troubleshoot a wider range of potential issues. In the future, I plan to provide additional guidance about how to use Microsoft Excel and how to make a scientific figure.
From the nature of this creative assignment that asks students to measure and interpret their measurements, I feel I have learned a lot more about the nature of student difficulties. The open-endedness of this assignment helped to show me the ways introductory students are conceptualizing physics problems that are not always apparent underneath layers of mathematical difficulty that students grapple with on many physics homework assignments. It is challenging to get students to explain their thought processes and reflect, and this assignment allowed students to do this.